How To Use This Template and Dashboard
As an HR Team, knowing how employees are progressing through your on-boarding process or team learning documents is important. This can help you understand where each employee is at in their learning, and can help you to identify learning opportunities for your team. With this Trello template, we have set up a workflow to track an on-boarding process for a new hire with benchmarks of 30, 60 and 90’s days for check-ins. Partnered with this template, is a Blue Cat Reports On-Boarding Dashboard that will give you insight in to where each employee stands as they move through your on-boarding process.

Get the template here.
We recommend that each newly hired employee has their own Board to track this progress.
List Set Up:
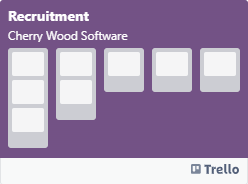
We have set up this Board using a separate List for each benchmark timeline in an employees on-boarding process. These Lists can be modified to reflect your specific process, but our On-Boarding Dashboard is built using this set up. Here, as employees complete each task in the List they move the Card to a Done List once it is fully completed.
Here is a brief outline of each List:
- On-Boarding Essentials - This List is a great place to outline important information for your employees as a reference tool. You can create individual Cards such as “Product Pricing” or “Product Websites” which employees can refer back to as needed. The Cards in this List may never move out of it, but that is ok.
- Tools & Programs - This List outlines all of the job-specific tools or programs that the employee may require to do their job. You can store things such as “User Name” or website address in the Card description so the employee knows how to access the tool/program.
- 90/60/30 Days - These Lists will hold a Card for each objective or task you would like your employee to complete during each of these benchmark timeframes.
- 1st Week - This List will hold all of the important tasks or objectives you would like your employee to complete in their first week of work. As your employees will be learning to work with Trello and this Board, it will be important to ensure your Cards are completed with as much details as possible so they understand how to utilize these Cards effectively.
- Doing - This List will hold all of the tasks that the employee is currently working on.
- Done - This List will hold all Cards once they have been completed by the employee. Cards moved in to this List can be validated by the employee’s direct report, and can be moved back in to a List if they feel it needs to be revisited.
Custom Fields:
All Custom Fields for this template as set up as dropdown fields.
- Priority - Here you can determine priority levels to assign to your tasks. Here we have used Low, Medium and High. This can help an employee determine which tasks are most important.
- Function - This can be used to assign each task to a particular function related to the employees job. In this case we have used Payment Processing, Email & Communication. Other suggestions would be things like Accounts Payable, Scheduling, Social Media etc...
Labels
For this template we have only assigned one Label to be used. We have assigned a Label for “I have questions” which an employee can add to any card they would consider a blocker, or that they need follow up on.
How to Use The Board
Once you have all of your Custom Fields, Lists, Automations and Labels set up, using the Board will be simple for your employees. Essentially the employees move through the assigned objectives or tasks and move the Cards to Doing when they start them and then to the Done List once completed. You can add new tasks at any point. They do not all have to be on the Board when the employee begins to work on it.
Once an employee begins to work on a task, they simply move the Card to the Doing List to indicate that they are working on it. Once it is completed, they move the Card to the Done List. They can have mutltiple tasks on the go at once.
To break a task or objective down in to smaller pieces, you could add a checklist to the Card so the employee can go through each piece and mark it off as they complete it. This way a Card can be in progress, but you will be able to see what is left to complete via the On-Boarding Dashboard.
Reporting Dashboard
This dashboard is set up to highlight and showcase your employees progress through their on-boarding. Using Blue Cat Reports, we can create and view these reports in real-time, view the Cards (or tasks/objectives in this case) and share them with colleagues and team members using the email sharing function.

You will need to create one of these dashboards for each employee you are following.
Learning Progress - This will show you how many tasks the employee is completing each day over a specified time period.
- Create a Historical Chart for completed Cards.
- Select the Done List as your completed List.
- Do not apply a filter so that we can see all completed Cards.
Tasks to Complete - This chart will show you how many tasks there are in each List on the board. This can be helpful to see what workload is to be expected at each benchmark time frame.
- Create a Bar Chart for open Cards.
- At the Data Breakdown stage, select List.
- Apply a filter for List and select 1st Week, 30 Days, 60 Days and 90 Days to show the Lists we want to evaluate.
Tasks by Priority - This chart will show you how many tasks there are assigned to the employee broken down by priority level.
- Create a Bar Chart for open Cards.
- At the Data Breakdown stage, select the custom field dropdown Priority.
- Do not apply a filter as we will be looking at ALL tasks on the Board.
Blocked Tasks - This will show you how many tasks the employee has used the “I have questions” Label on. This will be important so that you can quickly see what you need to follow up with your employee on.
- Create a Count or Sum of Cards for open Cards.
- Apply a filter for Labels and select “I have questions”
- You can drill down on this count by clicking on the number to see which Cards are included in this count. You can then go directly to the Cards in the list by clicking on the Card name.
List of Cards for 1st Week/30/60/90 Days - These Lists will show you details on each card contained within each of the benchmark time frame Lists. This can be helpful to see at-a-glace details about what your employee is working on from each period.
- Create a Quick List of Cards for open Cards.
- Apply a filter for Lists and then select the timeframe List you want.
- Create a seperate one of these for each of the benchmark time frame Lists.
- Once these Quick Lists are created, you can change the columns displayed by selecting the “Views” icon from the top right corner of the chart tile. Add or remove whatever columns you’d like to view only the information you want to see.

