How To Use This Template and Dashboard
As an HR Team, it is often important to track your recruitment pipeline. Knowing how many applicants you have in the pipeline, for what positions and where each candidate is in the process is crucial for staying on top of hiring. With this Trello template, we have set up a workflow for tracking candidates as they enter your pipeline and progress through this process. Partnered with the template is a Blue Cat Reports Recruitment dashboard that will give you insight in to what is happening on your board.

Get the template here.
List Set Up:
We have set this Board up using a separate List for each stage of a recruitment process - from candidate applications, all the way through to an accepted offer. Here is a brief outline of each List:
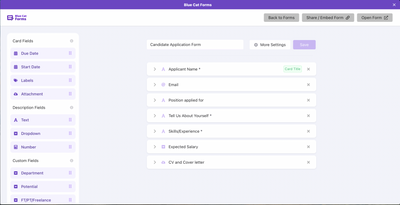
- Candidates - Once an application is submitted a Card is created for each candidate. See Using Blue Cat Forms for how to set up a Candidate Application form. The Card contains the candidates name as the Card title and all other pertinent information related to their application (see Custom Fields & Labels).
- Screening - Once the candidate's application is received, it would be moved in to this List as soon as someone starts to evaluate the application. Here, more details can be added to the Card based on information retrieved from the application (see Custom Fields & Labels).
- 1st Interview - Candidates will be moved in to this List once they have a first interview scheduled. Again, more details can be added to the Card based on the information uncovered during the interview - things like Salary Range and Category.
- 2nd Interview - Like First Interview, candidates will be moved to this List if and when they are passed to a second interview.
At any point in the recruitment process, if a candidate is deemed "unsuitable", they should be moved directly to the Pass List.
- Job Offer - Here is where the candidate's Card will sit while a job offer is drafted and waiting to be received.
- Negotiations - Many times, candidates will want to negotiate parts of their offers so this is where the Card will move during this process. Custom fields may need to be updated on their Card during this phase.
- Hired - Once a candidate has accepted the job offer and is hired, the Card will move to this List.
- Pass - Any unqualified candidates should be moved to this List.
Custom Field Set Up:
All Custom Fields for this template are set up as dropdown fields, with the exception of Start Date.
- Department - Here you can list all departments you have within your company or are hiring for. In our case we have Sales, Marketing, Dev and Operations. Other recommendations could be things such as Customer Service/Success, Management, Administrative, etc.
- Salary Range - Here you would list all of your salary ranges.
- Status - This would be used for the type of employee you are hiring (ie. Part Time, Full Time or Contractor).
- Category (or Potential) - Here you can qualify your candidates for fit or potential. In our case we have used Low, Medium or High potential.
- Start Date - Once a candidate has reached the final stage of your hiring process and you have a signed offer letter, you would input the candidate’s start date here. We will use this information later on when we generate our reporting dashboard.
How to Use The Board
Once you have all your Custom Fields and Lists set up, using this Board is very simple. Applicants each have their own Card and as you learn more details about them through the recruitment process you add information via the Custom Fields.
Blue Cat Forms is a great tool that can help with this process by creating Cards from application form submissions which can be pre-populated with details that the applicants will fill in themselves. Find out more about Blue Cat Forms and how it can help here.
Once an applicant has submitted their application, a Card with their name is created. You should be able to fill in details such as Department and Status upon Card creation. Your recruiters will then move the Candidate to the Screening List as they begin to process their application. At this stage, based on details from their application you can begin to add notes to the Card with any details you would like clarification on or things to ask in an interview.
Note: At any time in the recruitment process, if a candidate is deemed unsuitable, you should move them directly to the Pass List and effectively out of the recruitment pipeline.
Once a candidate is scheduled for an interview, they would be moved in to the 1st Interview List. Here details can be added to the candidates Card based on information gained during the interview. The interviewer can determine the candidate’s Category (Potential) and possibly even identify a Salary Range. Of course all of these Custom Fields can be modified along the way if any of the information changes during the course of your conversations.
At the next interview stage, the candidate would be moved in to the 2nd Interview List where more notes and details may be added.
Once a decision is made on a candidate they would either move to the Job Offer List or to the Pass List. Another option at this point would be if you felt the candidate was strong but not a fit at this moment, you could move them back to the Candidate List for future evaluation. Many candidates will want to negotiate parts of their offer letters, at which point the candidate should be moved to the Job Offer List. Here things like Salary Range, or Status may change.
When a candidate has a signed offer letter they can be moved to the Hired List and your recruitment process is complete!
Reporting Dashboard
This dashboard is set up to highlight and showcase important areas of your Recruitment Board. Using Blue Cat Reports, we can create and view these reports in real-time, view the Cards (or Candidates in this case), and share them with colleagues and team members using our email sharing function.

Total Candidates - This will show you how many candidates have applied and have yet to be processed in to the stages of your recruitment process.
- Create a Count or Sum of Cards for open Cards.
- Apply a filter for List and select the List titled Candidate.
Total Applicants In-Progress - This will show how many applicants are currently active in your recruitment process.
- Create a Count or Sum of Cards for open Cards.
- Apply a filter for List and select all Lists except for Candidates, Hired and Pass. This way you can see how many people you are currently processing.
Application Status - This chart will show you how many candidates are in each of the stages of your recruitment process.
- Create a Bar Chart for open Cards.
- At the data breakdown stage, select List.
Candidates by Department - This chart will show you how many candidates you have for each department within your company.
- Create a Bar Chart for open Cards.
- At the data breakdown stage, select your dropdown Custom Field titled Department.
- Apply a filter for List and select all Lists except for Candidates, Hired and Pass. This way you can see how many candidates are in the active recruitment process for each department.
Candidates by Salary Range - This chart will show you how many candidates you have in your recruitment process in each salary range you have established. This can be helpful for budgetary considerations to ensure you are hiring within your planned budget.
- Create a Bar Chart for open Cards.
- At the data breakdown stage, select your dropdown Custom Field titled Salary Range.
- Apply a filter for List and select all Lists except for Candidates, Hired and Pass. This way you can see how many candidates are in the active recruitment process at each salary range.
Candidates by Status - This chart will show you how many candidates you have in your recruitment process that are part time, full time or contractors.
- Create a Pie Chart for open Cards.
- At the data breakdown stage, select your dropdown Custom Field titled Status.
- Apply a filter for List and select all Lists except for Candidates, Hired and Pass. This way you can see how many candidates are in the active recruitment process by employment type.
Candidates by Potential - This chart will show you what percentage of your candidates are low, medium or high potential. You can use this to determine what your candidate pool looks like and if you need to focus more on attracting more higher potential candidates.
- Create a Pie Chart for open Cards.
- At the data breakdown stage, select your dropdown Custom Field titled Category (Potential).
- Apply a filter for List and select all Lists except for Candidates, Screening, and Pass. This way you can see how many candidates are in the active recruitment process by potential.
Recruitment Cycle Time - This chart will show you the median time it takes to complete your entire recruitment process. This metric is helpful to understand the lead time on hiring a new employee. By knowing how long it generally takes to move through the recruitment process you can better plan to fill upcoming vacancies.
- Create a Time to Complete Chart.
- At the data breakdown stage, select None.
- Your 1st In Progress List will be Screening, as this is the first list a candidate will move into once someone begins to process their application.
- Your Done List will be Hired, as this would indicate they have completed all stages.
- Do not apply a filter as we want to see all cards.
New Employees - This will give you a list of all newly hired employees with important details gained during the recruitment process. You can then sort this list by Start Date to see who is on-boarding at specific times.
- Create a Quick List of Cards for open Cards.
- Apply a filter for Lists and select Hired. This way you will only see candidates who have accepted job offers.

