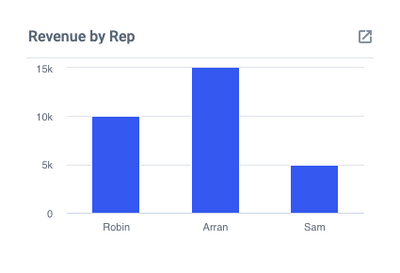
This chart will show the number of leads you and your team converted to sales vs the number of leads you generated, broken down by Sales Rep. This win/loss chart will show who is closing more leads.
This chart assumes you are using a List to identify Won/Lost. See Sales Teams Recommendations. You would need to create a separate one of these for each member of your team.

To get started, create a Pie Chart for completed Cards.
- Select your Won/Lost Lists.
- At the "Data Breakdown" step, you would want to group the data by List.
- At the filter stage, you would want to apply a filter for Label Member. Select which member of your team you would like to view.


