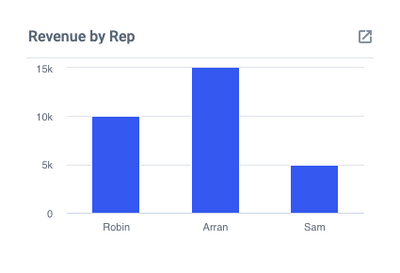
Similar to a Sales Cycle Length chart, this will show you how long it takes for Cards to move through your sales cycle broken down by source or category. This can be helpful to look at your individual source cycle times so you can see how long the process is for each category type.
We recommend using a dropdown custom field to identify source or category types. See Sales Teams Recommendations.

To get started, create a Time to Complete Chart.
- At the "Data Breakdown" stage you will select your custom field dropdown for Sales Source.
- Your "1st In Progress List" will be the very first List where your Cards are created to ensure we are tracking the total time to complete.
- Your "Done List" will be the final List your Cards end up in once the lead is closed.
Once completed you can set the display time frame by opening the calendar window from the bottom right-hand corner of the tile.
- You can use the pre-set time frames from the right hand side, or you can set your own custom time frame by using the calendar to set your start and end dates.


