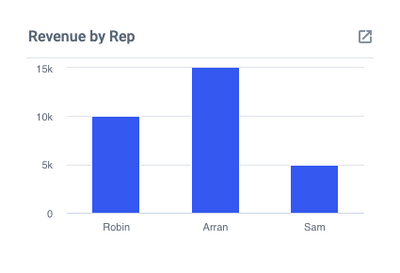
This chart will show you your total generated sales for Hot/Warm Prospects in your current sales funnel. This will give you a nice at-a-glace view of what is in the works and the potential total value of your hot/warm prospects. You would need to create a separate chart for Hot and Warm prospects.
We recommend using seperate custom fields to track your sales value and prospect category. See Sales Teams Recommendations.

To get started, create a Historical Chart for open Cards.
- At the "Totals" stage, you would select "Sales Value" to generate a sum of the field.
- At the filter stage, you would apply a filter for List. Select the List(s) you use to identify your current sales funnel.
- You would apply a secondary filter for the custom field dropdown "Prospect Category" and select your prospect category - in this case, Hot or Warm.
Once completed you can set the display time frame by opening the calendar window from the bottom right-hand corner of the tile.
- You can use the pre-set time frames from the right hand side, or you can set your own custom time frame by using the calendar to set your start and end dates.


