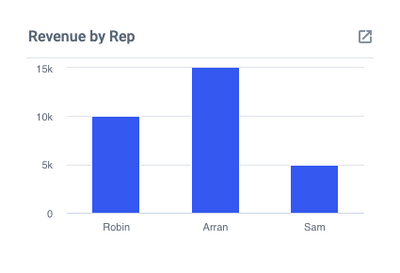
Total Funnel Size - Hot/Warm Prospects
This chart will show you the number of prospects you have that are categorized as Hot or Warm in your sales funnel, broken down by different metrics. There are many ways to modify this information to show you exactly what you'd like to see by simply changing how the data is broken down.
This chart assumes you are using a List(s) to identify your sales funnel, along with our other Sales Teams Recommendations.

To get started, create a Bar Chart for open Cards.
- At the "Data Breakdown" stage you could select the following:
- Member - this will display the number of prospects you have broken down by team member.
- Label - this will display the number of prospects you have broken down by whatever designation you are using your Labels for (See Sales Team Recommendations).
- Custom Field Dropdown - this will display the number of prospects broken down by whichever custom field drop down you choose to display.
- At the "Totals" stage you would select Cards.
- At the "Filter" stage you would apply a filter for List, and select the List(s) you use to identify all stages of your sales funnel.
- If you have several stages in your sales funnel and have separate Lists for each stage, you could also choose to view one List at a time to see how much is in each stage of your funnel.
- You would need to apply a secondary filter here to pinpoint only your Hot/Warm prospects.
- Here, you would apply a filter for "Prospect Category" and select either Hot or Warm or both.
- If you select only one category - this will display only prospects from the category you selected and you would need to create a second chart for the other category.
- If you select both - it will show you all prospects that are Hot/Warm only.
- Here, you would apply a filter for "Prospect Category" and select either Hot or Warm or both.


